Chapter 1: Introduction
- §1. Line Elements
- §2. Circle Trig
- §3. Hyperbola Trig
- §4. Geometry of SR
- §5. Differential Forms
- §6. Geodesics
- §7. The Physics of GR
The Geometry of Special Relativity
A spacetime diagram in special relativity is just a diagram drawn using hyperbola geometry. Vertical lines represent the worldline of an observer standing still (in the given reference frame). Horizontal lines represent a “snapshot” of time, according to that observer.
Lines tilted away from the vertical axis represent objects in motion, whose speed is given by the (reciprocal) slope of the line. The basic postulate of special relativity is that the speed of light is the same for all observers. Thus, the speed of light is special. But hyperbola geometry already has a special slope, namely $\pm1$, corresponding to the asymptotes of all the hyperbolas. Equivalently, the two lines with slope $\pm1$ can be thought of as the degenerate hyperbola $x^2-t^2=0$, all of whose points are at zero “distance” from the origin.
Without further ado, we henceforth adopt units such that the speed of light is 1. In other words, we measure both space and time in the same units, typically meters. Some authors indicate this by using coordinates $x$ and $ct$, with $t$ in seconds and $c=3\times10^8$ meters per second; we measure time directly in meters, so that $c=1$ (and is dimensionless!).
A useful thought experiment is to consider two train cars (reference frames), moving with respect to each other at constant speed. Suppose a lamp is turned on at the center of one of the cars when they are even with each other. (Since the speed of light is constant, it doesn't matter whether the lamp is moving.) When does the light reach the front and back of the cars? Each observer sees the light travel equal distances at the speed of light, so each must independently conclude that the light reaches both walls simultaneously. But each observer sees the other observer moving toward one light beam, and away from the other, and therefore concludes that the other observer does not see the light reach both walls simultaneously! Thus, observers in relative motion must have different notions of simultaneity. A spacetime diagram of this situation is shown in Figure 1.
See Applications for further details.
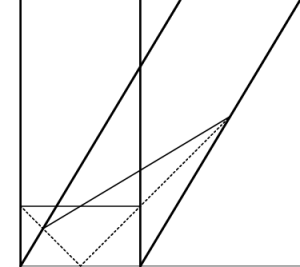 Figure 1: The heavy lines represent the ends of two train cars, one at rest (vertical lines), the other moving to the right. The dashed lines represent beams of light emitted in the center of both cars. Each observer sees the light reach both ends of their car at the same time, corresponding to two different notions of simultaneity, as denoted by the thin lines connecting the respective intersection points.